Network graph
Graphical representations are a direct expression of how researchers think about a network model. They convey an intuitive understanding of network structures, relationships, and other properties central to the dynamics, and may also reflect how a model is implemented. If similar diagram styles are used, diagrams facilitate the reading of an article and allow for comparability of models across publications.
For visually constructing and inspecting network graphs, NEST Desktop builds on the graphical notation introduced in the article “Connectivity concepts in neuronal network modeling” [1]. We suggest to cite this article as a permanent reference for the proposed notation, while this documentation serves as a living reference allowing for further modification.
Here, we define the graphical elements used for Network nodes and Edges. We also provide details on the conventions for the Annotation of an edge as introduced in the paper [1], even though they are presently not included in the NEST Desktop interface, and finally we show an Example.
Network node
A network node in the notation represents one or multiple units.These units are either neuron or neural population models, or devices providing input or output. Network connectivity is defined between these graphically represented nodes. Nodes are drawn as basic shapes. A textual label can be placed inside the node for identification. Nodes are differentiated according to a node class and a node type.
Node class
The node class determines if a node represents an individual unit or a population of units by different frames of the shapes depicting the nodes. The distinction is a recommendation for diagrams that contain both kinds of nodes.
Individual unit
A node representing an individual unit may be depicted as a shape with a thin, single frame. Note that such an individual unit may be a population (e.g., neural mass) model.
Population
A node representing a population of units may be depicted as a shape with either a thick frame or a double frame. It is in principle possible to represent a group of population models this way.
Node type
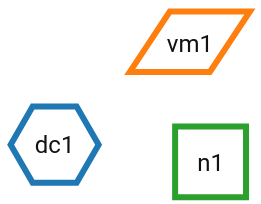
The node type refers to a defining property of a node and is expressed by a unique shape.
Generic node
A generic node, represented by a square, is used if the specific node types do not apply or are not intended to be emphasized.
Excitatory neural node

An excitatory neural node, depicted by a triangle, is used if the units represent neurons, and their effect on targets is excitatory.
Inhibitory neural node
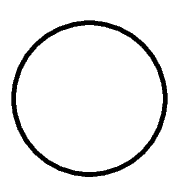
An inhibitory neural node, depicted by a circle, is used if the units represent neurons and their effect on targets is inhibitory.
Stimulating device node
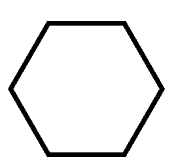
A stimulating device node, depicted by a hexagon, provides external input to other network nodes. Stimulating devices can be abstract units which for instance supply stochastic input spikes. Nodes with more refined neuron properties can also be considered as stimulating devices if they are external to the main network studied.
Recording device node
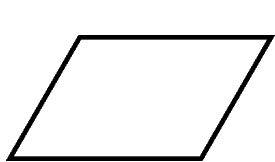
A recording device node, depicted by a parallelogram, contains non-neural units that record activity data from other network nodes.
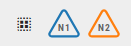
Node label
Each node graph is labeled to identify the model of the node. By default, it creates a direct current generator (dc) for a stimulus and a voltmeter (vm) for a recording device. Neurons are just labeled with (n). You can find the full label of the node model in the network controller.
Note
Node label is not defined in connectivity concept [1].
Node color
In NEST Desktop, nodes and connections contain parameter configurations which are displayed in the controller panel in the side navigation. The color of nodes helps you to associate the network graph with the controller as well as the corresponding visualization of the network activity.
Note
Node color is not defined in connectivity concept [1].
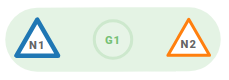
Node group
Nodes can be grouped for better network structure, e.g. hierarchical structure. Select multiple nodes with Ctrl key and then click on group button.
It creates a group containing selected nodes.
In code editor it shows a new group g1 = n1 + n2.
Node group can be connected with nodes or other node groups.
Note
Node group is not defined in connectivity concept [1].
Network edge
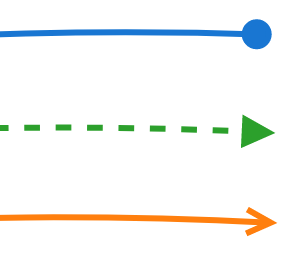
A network edge represents a connection or projection between two nodes. Edges are depicted as arrows. Both straight and curved lines are possible. Edges are differentiated according to the categories determinism, edge type, and directionality.
Determinism
The notation distinguishes between deterministic and probabilistic connections via the line style of network edges. Edges between two nodes representing individual units are usually deterministic.
Deterministic

Deterministic connections, depicted by a solid line edge, define exactly which units belonging to connected nodes are themselves connected.
Probabilistic

Probabilistic connections, depicted by a dashed-line edge, are constructed by connecting individual neurons from source and target populations according to probabilistic rules.
Edge type
Analogously to the node type, the edge type emphasizes a defining property of the connection by specific choices of arrowheads. The edge types given here can be used for connections between all node types.
Generic edge
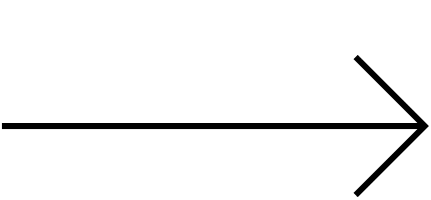
A generic edge, represented by a classical (or straight barb) arrowhead, is used if the specific edge types do not apply or the corresponding properties are not intended to be emphasized.
Excitatory edge
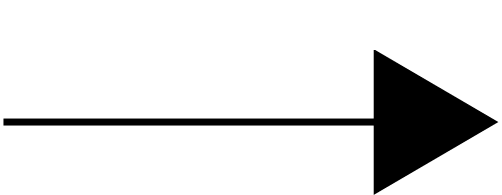
An excitatory edge, depicted by a triangle arrowhead, is used if the effect on targets is excitatory.
Inhibitory edge
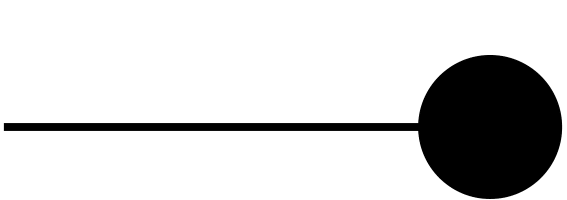
An inhibitory edge, depicted by a filled circle tip, is used if the effect on targets is inhibitory.
Directionality
Unidirectional
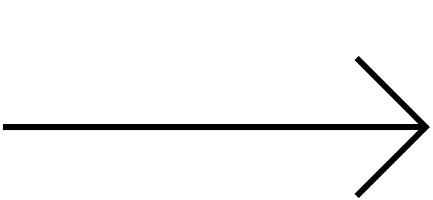
Unidirectional connections are depicted with a tip at the target node’s end of the edge.
Bidirectional
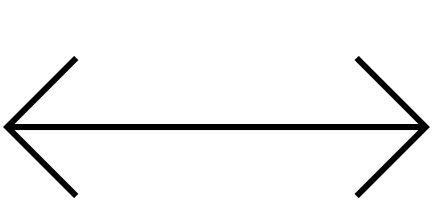
Bidirectional connections are symmetric in terms of the existence of connections and their parameterization. Such connections are depicted with edges having tips on both ends. If the same units are connected but parameters for forward and backward connections are not identical, two separate unidirectional edges should be used instead.
Edge color
The edge color is determined by the color of the source node.
Note
Edge color is not defined in connectivity concept [1].
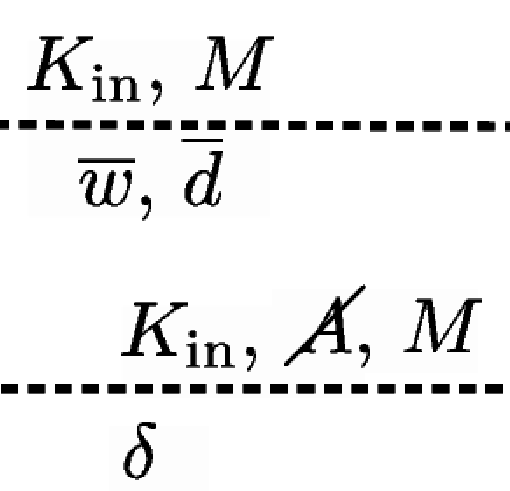
Annotation
Network edges can be annotated with information about the connection or projection they represent. Details on the rule specifying the existence of connections and their parameterization may be put along the arrow.
Note
Annotation is not available in NEST Desktop.
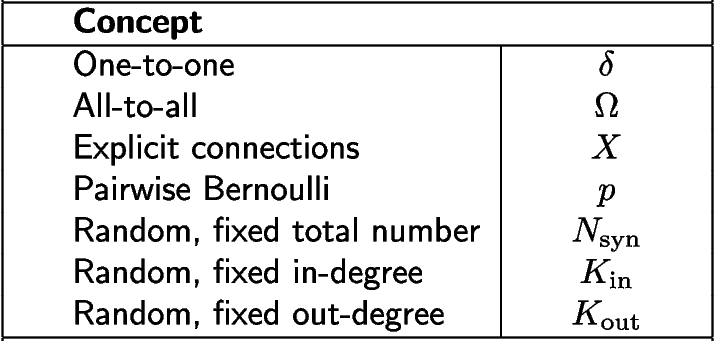
Connectivity concept
The properties in this category further specify the presence or absence of connections between units within the connected nodes.
Concept
The definitions and symbols given in the connectivity concepts [1] (for a permanent reference) and in the Connectivity concepts (for a living reference) are the basis for this property.
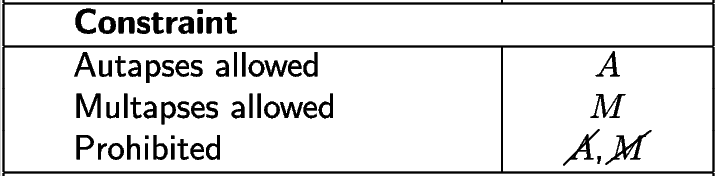
Constraint
Specific constraint or exception to the connectivity concept.
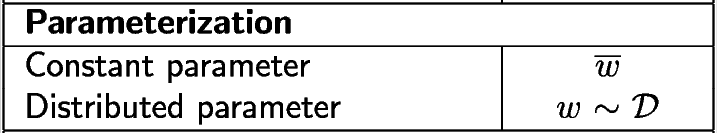
Parameterization
Properties of the parameterization of connections, e.g., of weights \(w\) and delays \(d\), can be expressed with mathematical notation.
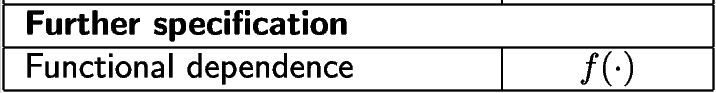
Further specification
Annotations for both the connectivity concept and the parameterization of connections can be specified further.
Note
For a discussion on customization and extension see the paper [1].
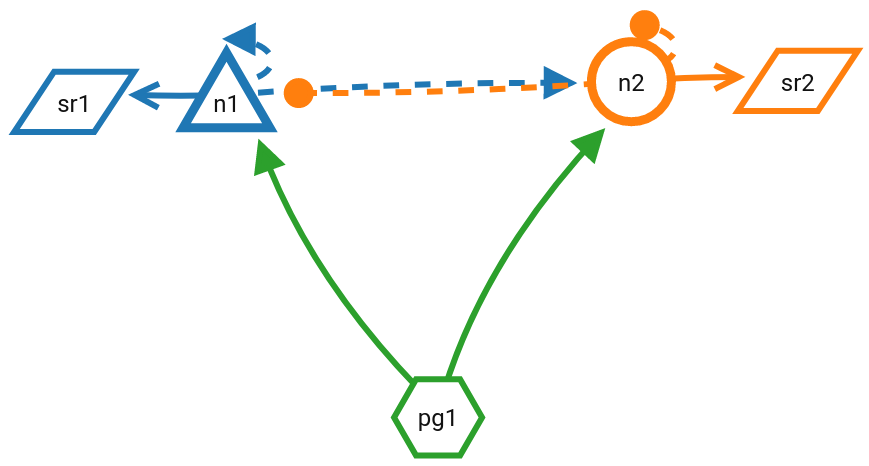
Example
Graphical notation
NEST Desktop
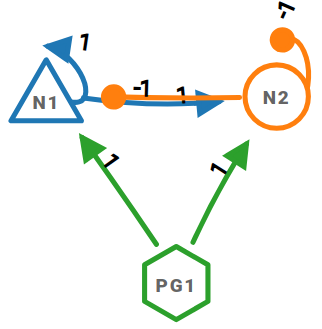
The example is a balanced random network model with the random, fixed in-degree connectivity. The illustration uses the elements for nodes, edges, and annotations introduced above to depict the network composed of an excitatory (E, triangle) and an inhibitory (I, circle) neuron population, and a population of external stimulating devices (\(E_\text{ext}\), hexagon). Recurrent connections between the neurons in the excitatory and inhibitory populations are probabilistic (dashed edges) and follow the “random, fixed in-degree” rule (\(K_{in}\)) with the further constraints that autapses are prohibited (\(\cancel{A}\)) and multapses are allowed (\(M\)).
Here, the NEST Desktop version also displays spike recorders.
Note
Annotations are not available in NEST Desktop.
To generate static publication-ready visualizations of network graphs in agreement with the graphical notation (corresponding to the figure on the left), please refer to this lightweight LibreOffice extension for the graphical notation.
Further examples can be found in paper about connectivity concepts [1].
References
Acknowledgements
Thanks for the applying graphical notation in NEST Desktop:
Johanna Senk (Jülich)
Clemens Köhn (Jülich)