Activity chart graph
The chart graph contains graphical panels organized in vertical stacks. Chart panels are introduced specifically to explore the network activity by mouse interaction. The simulation produces two different types of data sets: Spike events contain times and sender ids whereas analog signals contain continuous quantities from the recording devices.
See also
Analog signals
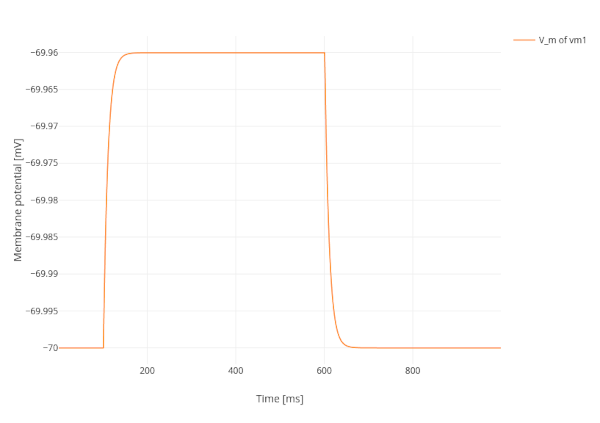
Neuron receiving step current input displays a line trace of the membrane potential.
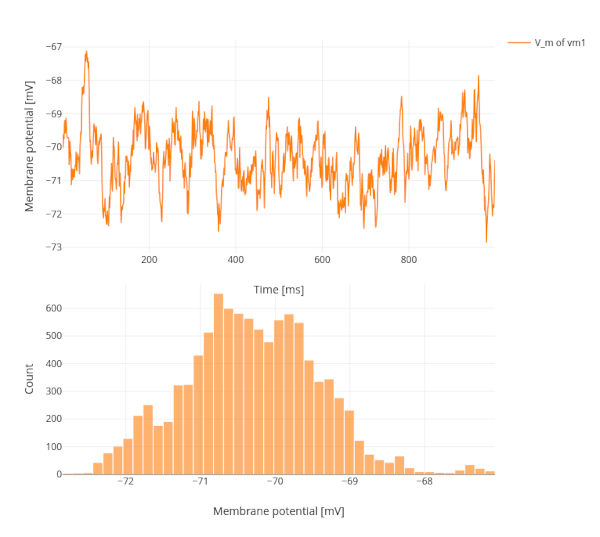
Receiving noise inputs shows fluctuation of the membrane potentials and histogram of distributed values.
Spike activity
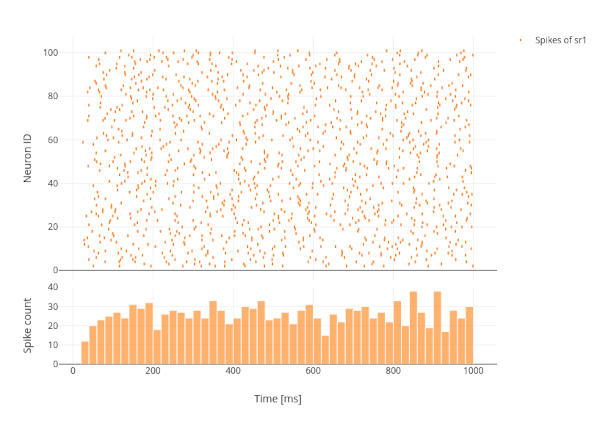
A population of neurons displays a raster plot of the spike times as well as a time histogram of spikes.
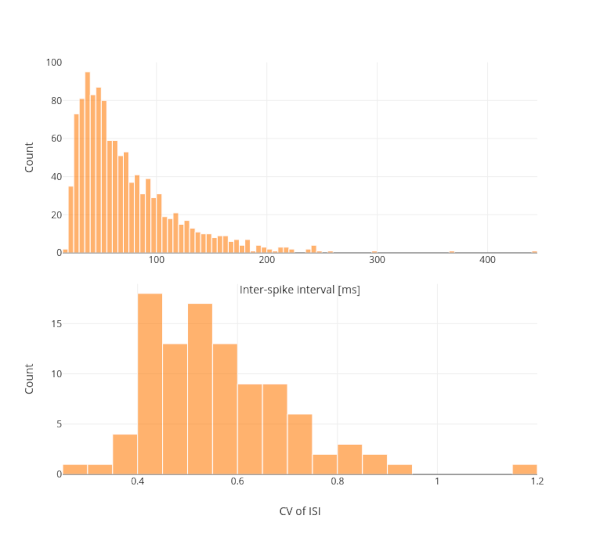
Here, it shows a value histogram of the inter-spike intervals (ISI) as well as of the coefficients of variation of the ISI (CV of ISI) for the population.
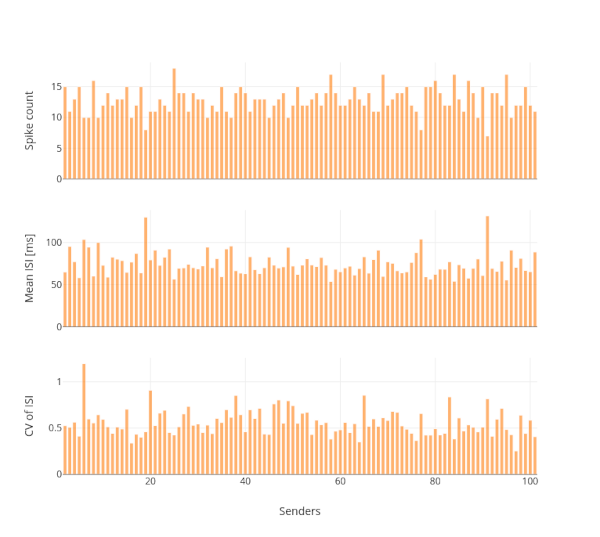
In this panel it shows spike count, average Inter-spike interval (ISI) and coefficient of variation (CV of ISI) for each sender, e.g. neuron.