Project view
NEST Desktop has a project management helping you to organize your networks and network activity. contains a Project navigation sidebar, a Project bar and content for Project subpages.
If you want to explore the network activity of the project, you have to start the simulation before ( Simulate networks).
Project navigation sidebar
In the navigation sidebar you find a search field, a Projects menu and then a Project list.
Projects menu
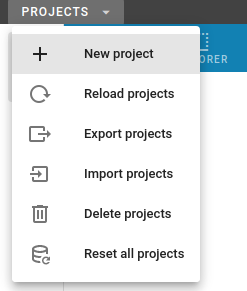
The projects menu will be displayed when the user clicks the button right to search field. In menu you find items to import, export , delete multiple projects or reload project list. Clicking on the items to export, import or delete projects opens a dialog showing a list of project ( Project dialog).
Warning
You should export projects that you want to keep: If you reset your browser or delete the site data, the project will be lost!
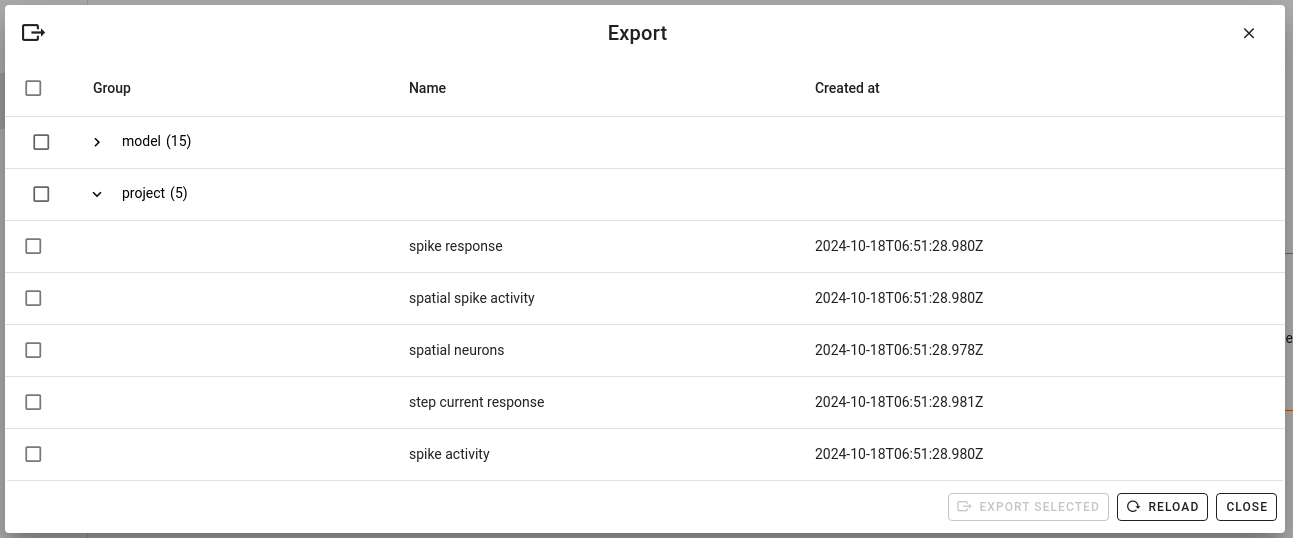
Project dialog
It is possible to import projects from different sources: You can choose between drive (local storage), GitHub and URL (other one than GitHub URLs). The GitHub category points to a model collection available in the separate NEST Desktop model repository.
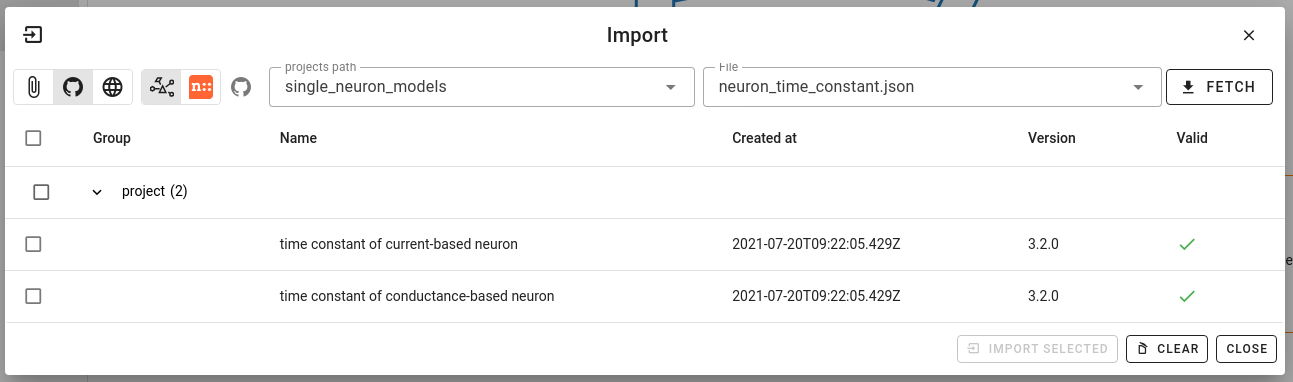
Note
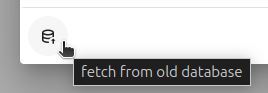
You are able to fetch projects/models from old database. Click the button at the bottom-left corner.
In export dialog you are able to export multiple projects and models together to a single file.
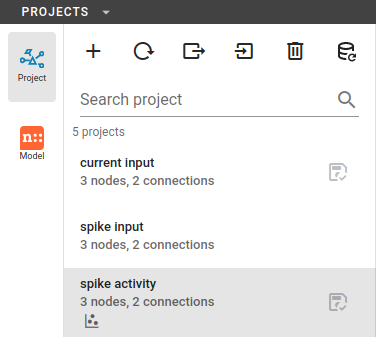
Project list
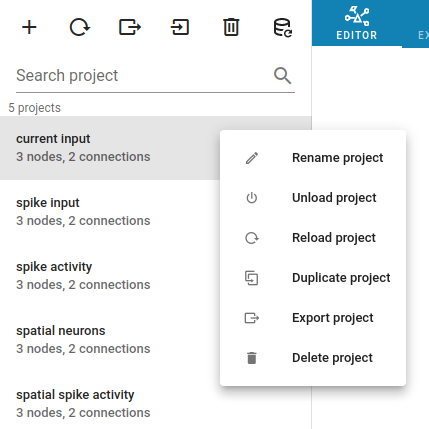
You find the search field and a list of the projects. Select a project to load it for the usage. Once a project is loaded, a save icon () appears on the right side. You can move the mouse on the project item, it shows three vertical dots () for a menu with options to rename (), unload (), reload (), duplicate (), export () or delete () this project.
Warning
Unless you click on the save button, the project is not stored in the database of the web page cookie and is lost when you reload the page!
Another important remark is that NEST Desktop stores only projects with neuronal networks in the cookie database, but all activity (i.e. simulation results) will be lost after page reload!
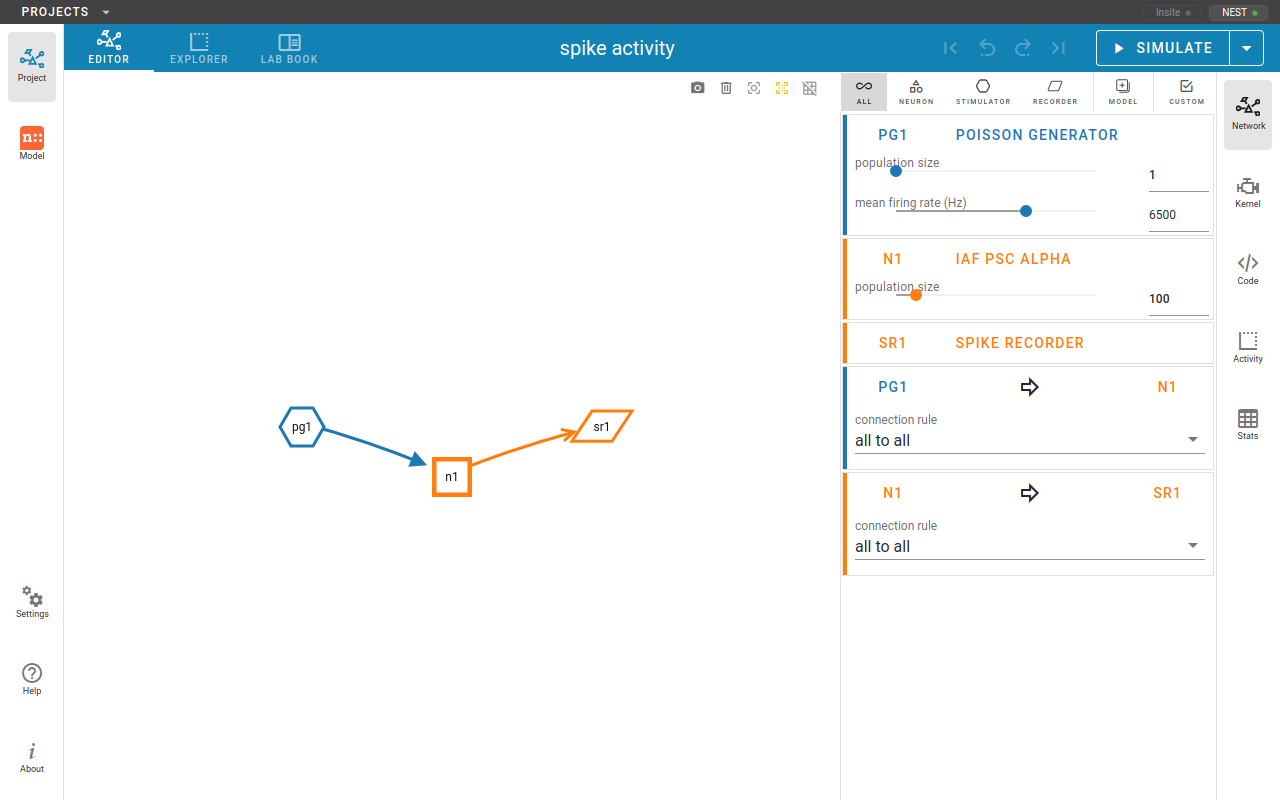
Project bar

The project bar contains tabs for Project subpages, the project name, the Network history and the Simulation button.
Tip
It is useful to give project a proper name so that you can recognize your projects quickly.
Network history
After every network change, NEST Desktop pushes a snapshot of the current network to the edit history list. With that history of the network, you can undo or redo the network changes. Loading a snapshot from this history is called checkout network.

Simulation button
You can click on the SIMULATE button to start the simulation.

Project subpages
Network editor
Network editor is designed to edit nodes and connections on network graph.
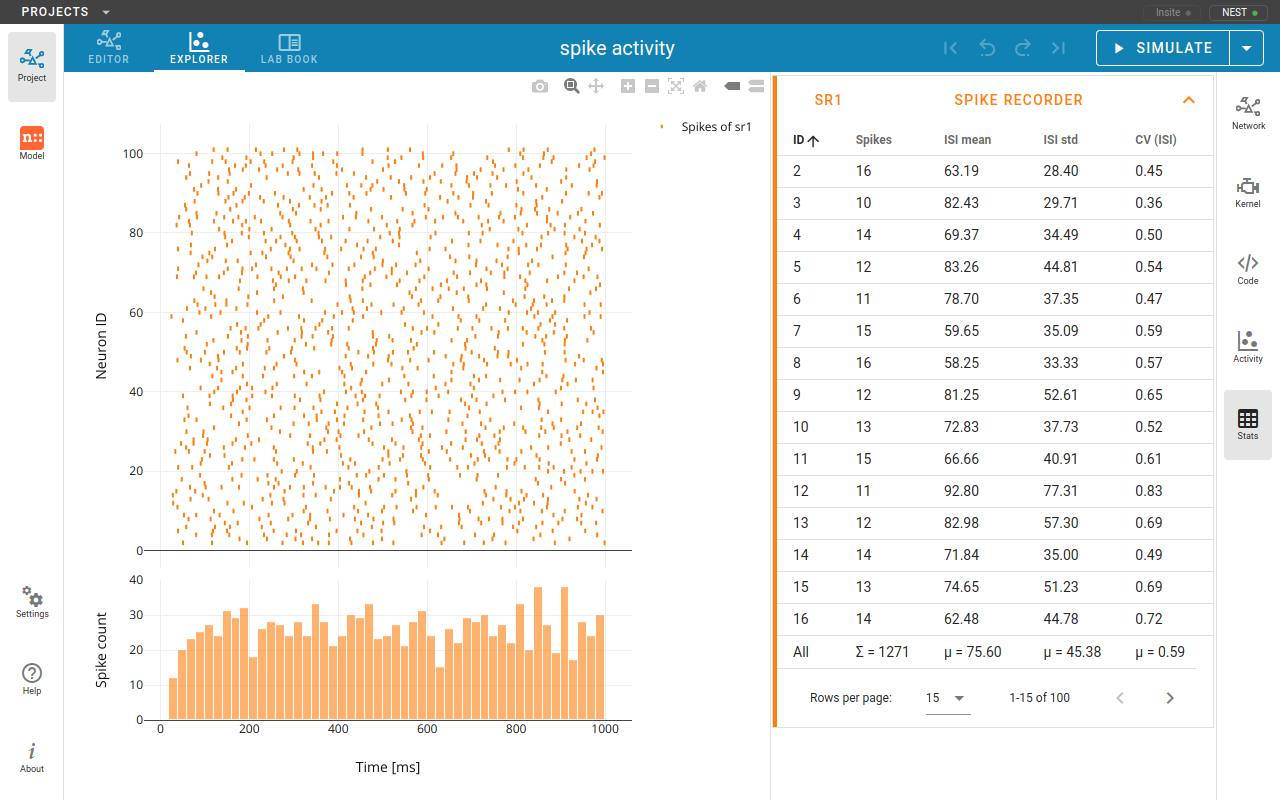
Activity explorer
Activity explorer allows user to explore activity of the simulated network model.
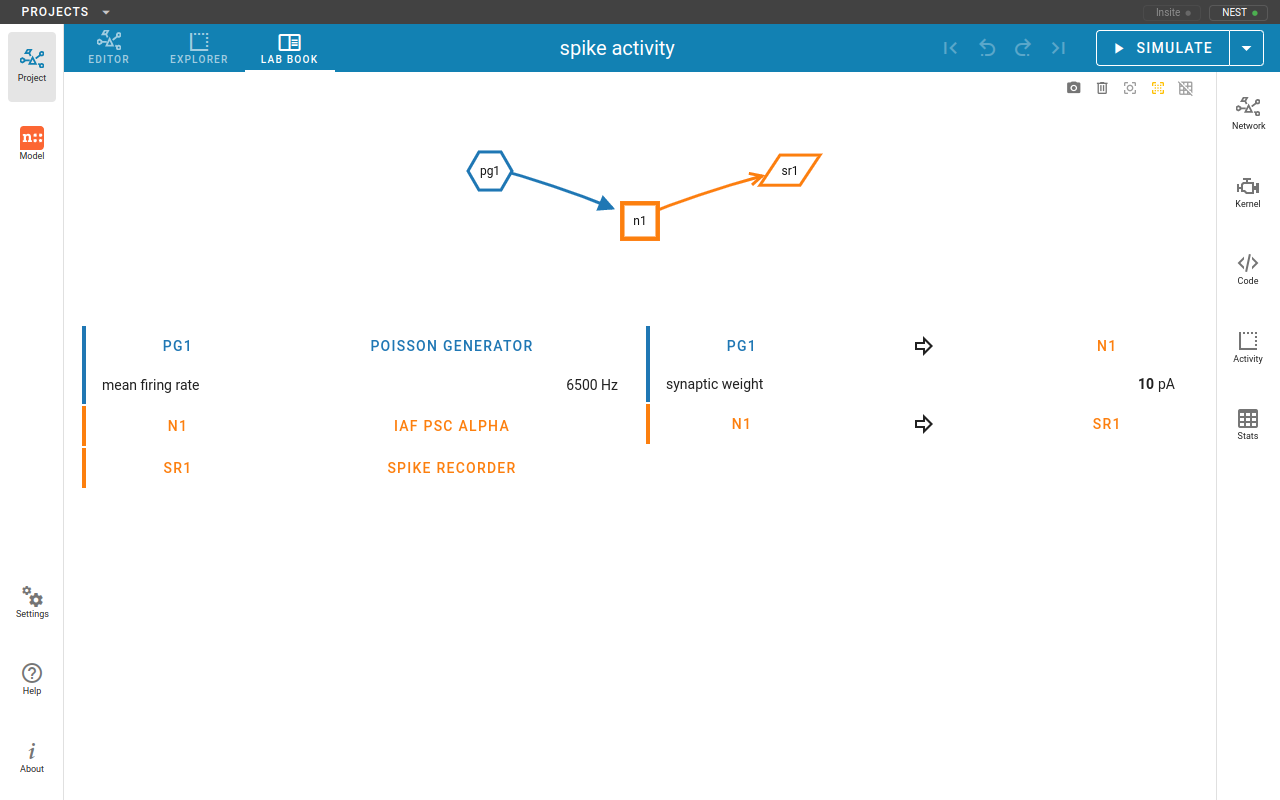
Lab book
Lab book gives a fancy overview on network setup.
Controller sidebar
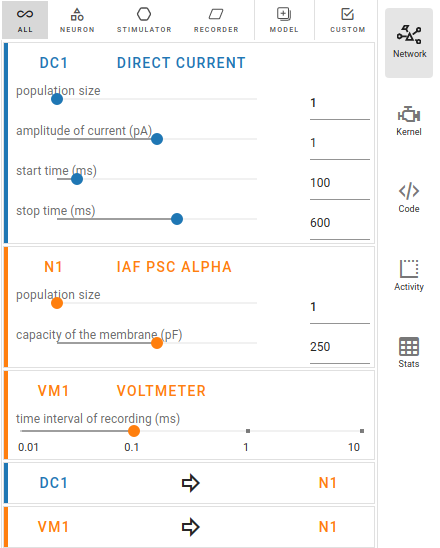
Network controller
The network controller displays cards of models, nodes and connections.
See also
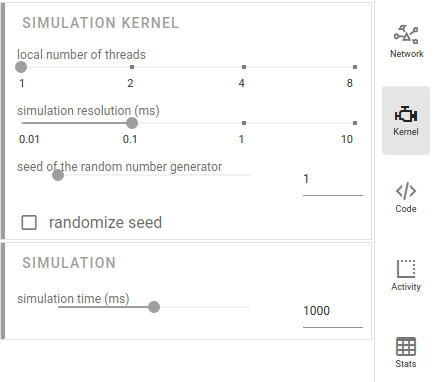
Kernel settings
The simulation parameters can be adjusted in the right sidebar. They are contained in the NEST Simulator code (more information below), so they will be passed to the NEST Simulator whenever a simulation is started.
In the Kernel settings, the slider local number of threads allows to set the number of processes used by the NEST Simulator.
It is possible to edit the simulation resolution.
Note
Here, you should be aware of the created load on the NEST Simulator as well: Small values for the resolution size create many calculations and data points. Therefore, selecting small values for the simulation resolution can lead to freezes and lags, so please be patient when you choose a small number.
The seed of the random number generator can also be modified. The same seed produces the same simulation output.
It is possible to activate randomized seed that it generates new seed before each simulation.
The simulation time can be set as well (in Milliseconds).
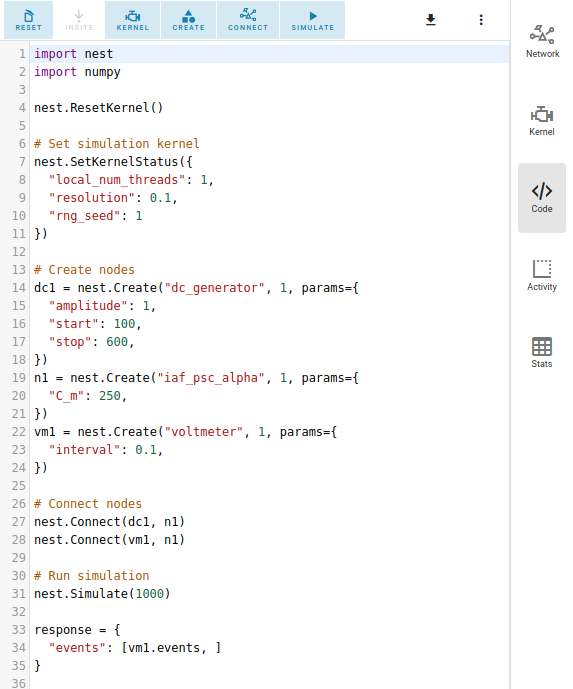
Code editor
NEST Desktop generates textual code from the constructed network. The generated code can be executed in any Python
interpreter. This way, the code semantics of the NEST Simulator is understandable and easy to learn. The script
code starts with importing required modules (import ...) and resetting the simulation kernel
(nest.ResetKernel()). It is necessary, because the old settings/imports of previous simulations have to be
removed. Otherwise, errors may occur, e.g. with duplicate imports.
The simulation kernel can be configured by nestSetKernelStatus(...).
The graphical representatives of the nodes deliver arguments to the block of the nest.Create(...) function.
Furthermore, the properties of connections are integrated in the block of the nest.Connect(...) function.
The function nest.Simulate(...) triggers the simulation of your constructed network.
All recording nodes fill a block to collect activities containing neuronal properties, e.g. node ids and positions, and activity events.
Activity controller
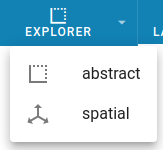
The activity controller displays different content depending on the visualization mode (abstract or spatial) of the activity graph.
Activity chart controller
Every chart panel has an own controller card fur individual customization. Other chart models can be chosen individually for each panel by clicking on the card toolbar in the activity controller.
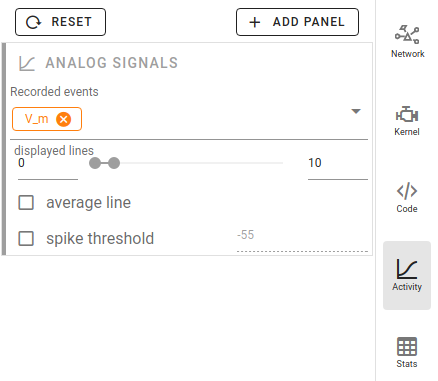
Analog signals
By default, NEST Desktop shows traces of the analog signals as a function of time. A panel with a histogram of values can be added when you select it in the + ADD PANEL dropdown menu.
When something doesn’t work properly, you can reset the panels to default by clicking on RESET.
You can add more recorded signals to the panel when it comes from multimeter. Node records appear as chips in the cards, which allow you to change the colors of the corresponding traces and bars.
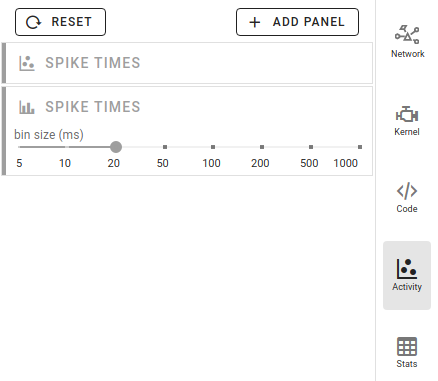
Spike activity
By default, a raster plot of the spike times as well as a histogram for spike times is shown.
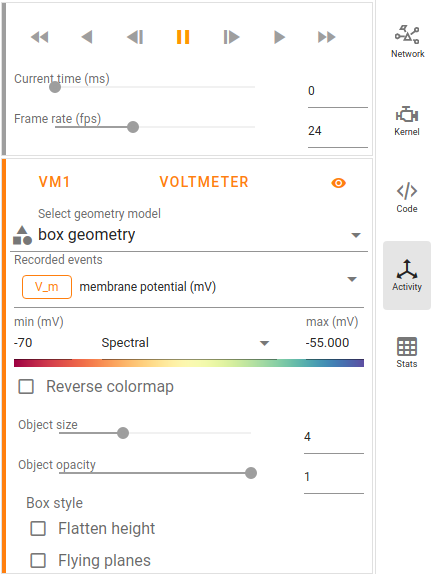
Activity animation controller
The animated graph displays activity (analog signals or spikes) for the spatial network forming layers in topology whose neurons have geographical positions.
Values of the analog signals can be visualized using the colors of recorded targets. Here, it shows the color map spectral for the value scales (from min to max). You can change the color map in the dropdown menu between the input fields of the min and max values.
Additionally, an other geometry model (box or sphere) can be chosen.
We recommend to try out many different options for the animation graph to find the best representation, as the optimal ones depend heavily on the simulation data and the intended use of the visualization.
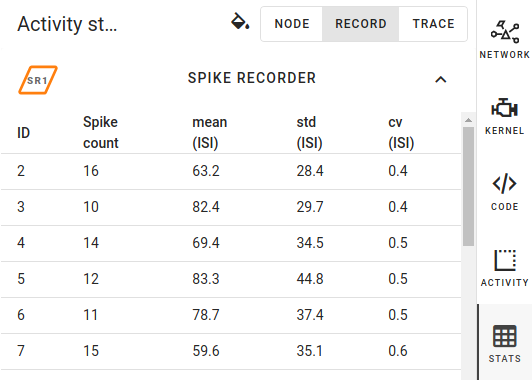
Activity statistics
It displays multiple panels for each recording device. In each panel a table shows the activity statistics of recorded elements (rows) of a node (population).
In spike events, the columns show the spike counts, mean and standard deviation of \(ISI\) (inter-spike interval) as well as \(CV_{ISI}\) (coefficient of variation in inter-spike intervals).
In analog signals (e.g. membrane potentials), the columns show the mean and standard deviation of the values.