Basic Usage Guide
This is a basic usage guide for the Graphical User Interface (GUI) of NEST Desktop.
Note
You can reload the application (Strg+R or F5) if NEST Desktop has somehow crashed.
Video tutorial
The video shows the first steps to construct a network and explore its activity.
Note
This video shows older NEST Desktop (v3.1). Some components might look differently but they can be interpreted for the new one.
First steps
If you want to construct a network, you will have to open the network editor. The network editor shows the network graph composed of nodes (shapes) and connections (lines).


In order to create a new node, you can click with the right mouse button in the network editor and a circular panel with three letters appears to select an element type. A node is divided into three element types: stimulator (S), recording (R) device and neuron (N). Click on one element type, a menu of models in corresponding element type appears. Then, selecting a model creates a node of the selected model.
Forming a network of nodes is defined by making connections between and within nodes. In order to connect nodes, you can click on a connector of a node, then move the mouse towards anther node and finally click on a target node. It creates a connection between source and target nodes.
Hint
By pressing the hotkey Alt and clicking a node at the same time, you enable the connecting mode or continue connecting other nodes.
You are able to select the model of a node in the network controller. Then it shows a list of parameters which you might want to work on. Finally, you are able to change the values of visible parameters.
You can click on the SIMULATE button to start the simulation of your network. In the code editor you can inspect the generated script code.

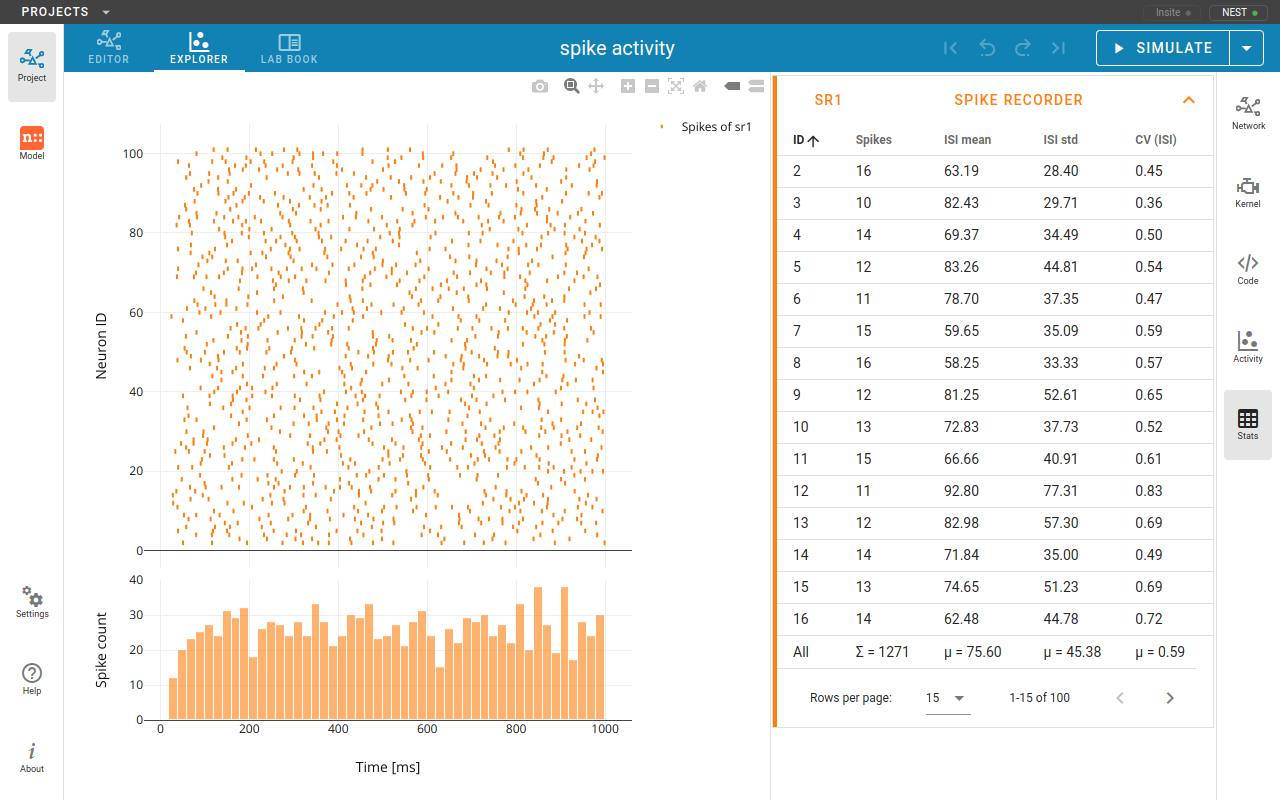
The network activity is composed of neuronal properties (neuron positions and ids) and recorded events from recording devices. Events can be subdivided in two groups: spike events and analog signals. Spike events contain times and ids of the senders emitting events to the recording devices which can be considered as collectors (spike recorder). Analog signals contain continuous quantities from the recording devices aka samplers (voltmeter or multimeter) which query their targets at given time intervals. Network activity can be explored in Activity chart graph ( or ) Activity animation graph (), or Activity statistics ().