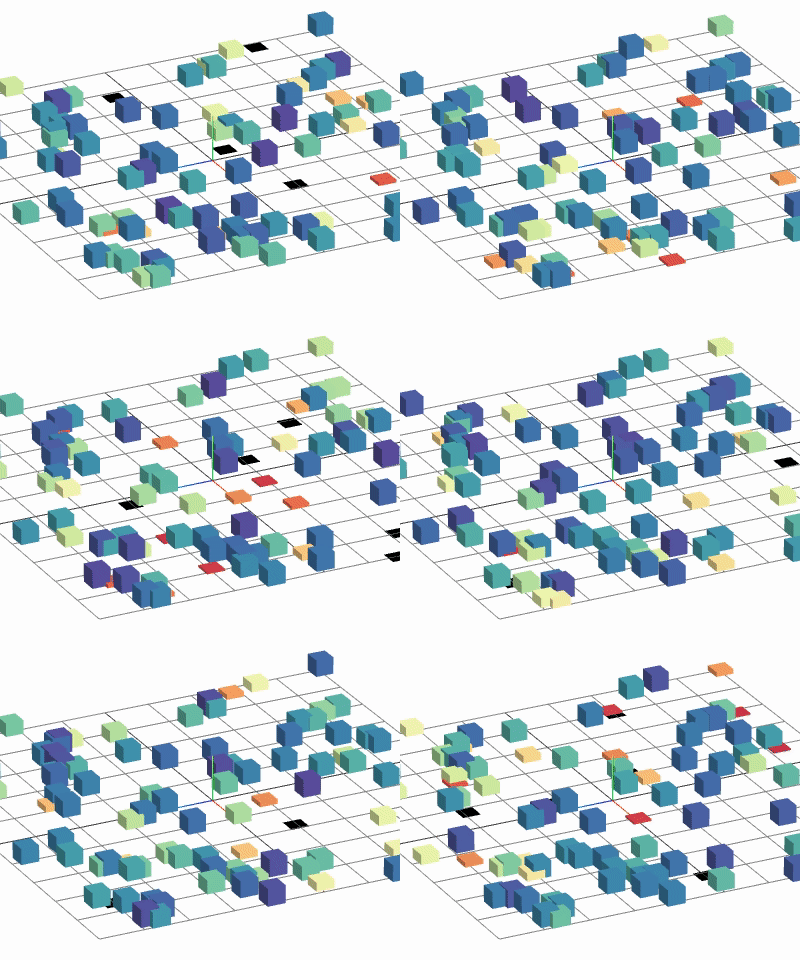
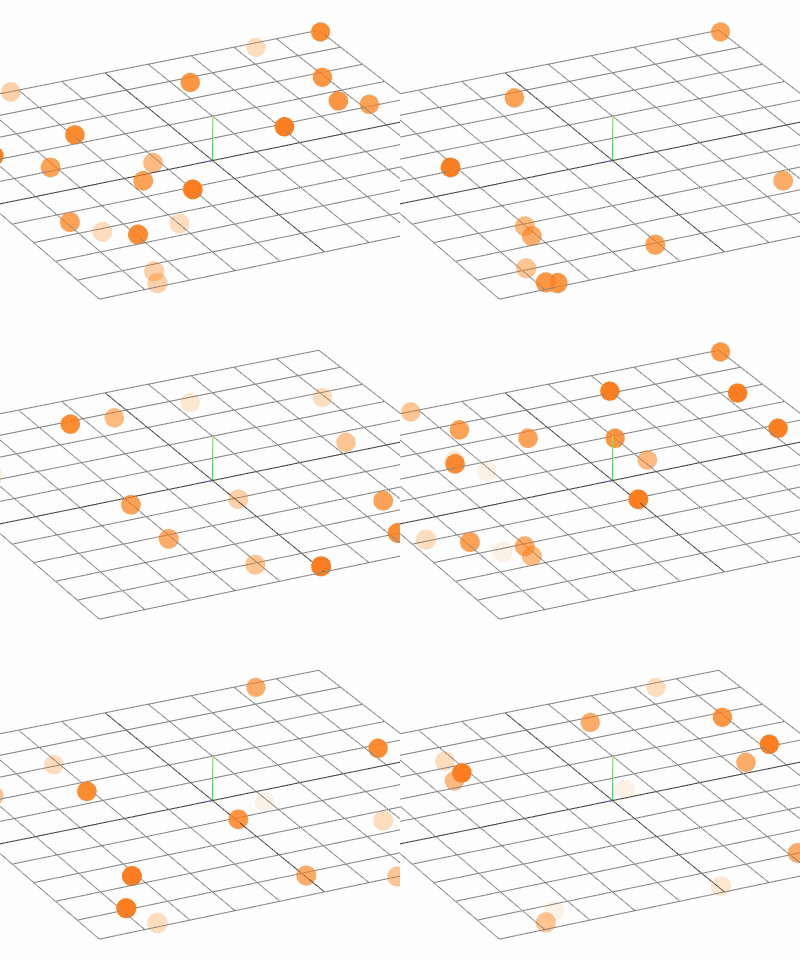
 Activity animation graph
It displays an animated 3D graph for the spatial network forming layers in topology whose neurons have geographical positions.
See also
Analog signals

Analog signals contain continuous quantities from the recording devices (voltmeter or multimeter).
It is possible to display an animated 3D graph for the spatial network forming layers in topology whose neurons have geographical positions.
Each box represents a neuron in its geographical position. Values of the analog signals can be visualized using the colors of recorded event (here, it shows the color map spectral).
Spike activity

Spike events contain times and ids of the senders collected by the spike recorder.
Spikes can be visualized as transient blobs appearing in the animated 3D graph. To follow the spike activity better, the trail length can be increased.
Optionally, trails can be faded after the spike time, and a growing or shrinking mode can also be applied.