Controller sidebar
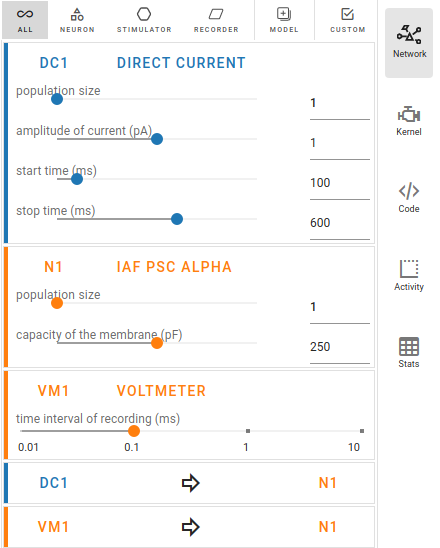
Network controller
The network controller displays cards of models, nodes and connections.
See also
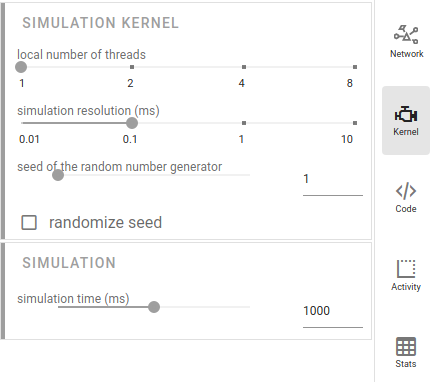
Kernel settings
The simulation parameters can be adjusted in the right sidebar. They are contained in the NEST Simulator code (more information below), so they will be passed to the NEST Simulator whenever a simulation is started.
In the Kernel settings, the slider local number of threads allows to set the number of processes used by the NEST Simulator.
It is possible to edit the simulation resolution.
Note
Here, you should be aware of the created load on the NEST Simulator as well: Small values for the resolution size create many calculations and data points. Therefore, selecting small values for the simulation resolution can lead to freezes and lags, so please be patient when you choose a small number.
The seed of the random number generator can also be modified. The same seed produces the same simulation output.
It is possible to activate randomized seed that it generates new seed before each simulation.
The simulation time can be set as well (in Milliseconds).
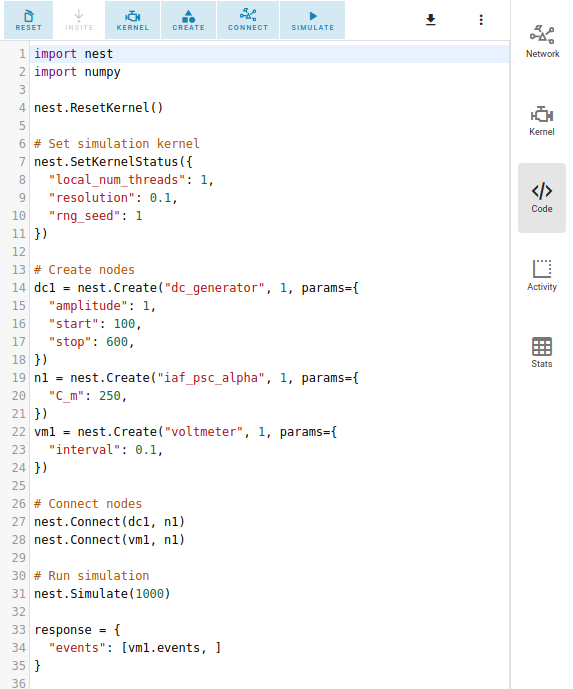
Code editor
NEST Desktop generates textual code from the constructed network. The generated code can be executed in any Python
interpreter. This way, the code semantics of the NEST Simulator is understandable and easy to learn. The script
code starts with importing required modules (import ...) and resetting the simulation kernel
(nest.ResetKernel()). It is necessary, because the old settings/imports of previous simulations have to be
removed. Otherwise, errors may occur, e.g. with duplicate imports.
The simulation kernel can be configured by nestSetKernelStatus(...).
The graphical representatives of the nodes deliver arguments to the block of the nest.Create(...) function.
Furthermore, the properties of connections are integrated in the block of the nest.Connect(...) function.
The function nest.Simulate(...) triggers the simulation of your constructed network.
All recording nodes fill a block to collect activities containing neuronal properties, e.g. node ids and positions, and activity events.
Activity controller

The activity controller displays different content depending on the visualization mode (abstract or spatial) of the activity graph.
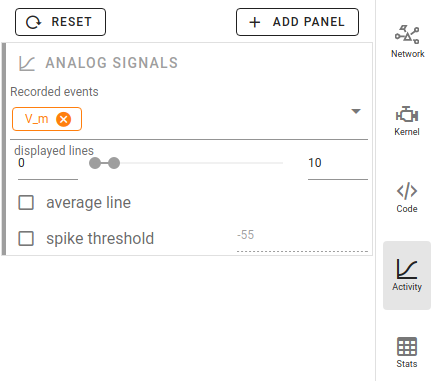
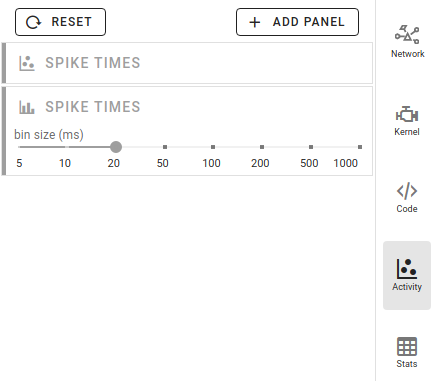
Activity chart controller
Every chart panel has an own controller card fur individual customization. Other chart models can be chosen individually for each panel by clicking on the card toolbar in the activity controller.
Analog signals
By default, NEST Desktop shows traces of the analog signals as a function of time. A panel with a histogram of values can be added when you select it in the + ADD PANEL dropdown menu.
When something doesn’t work properly, you can reset the panels to default by clicking on RESET.
You can add more recorded signals to the panel when it comes from multimeter. Node records appear as chips in the cards, which allow you to change the colors of the corresponding traces and bars.
Spike activity
By default, a raster plot of the spike times as well as a histogram for spike times is shown.
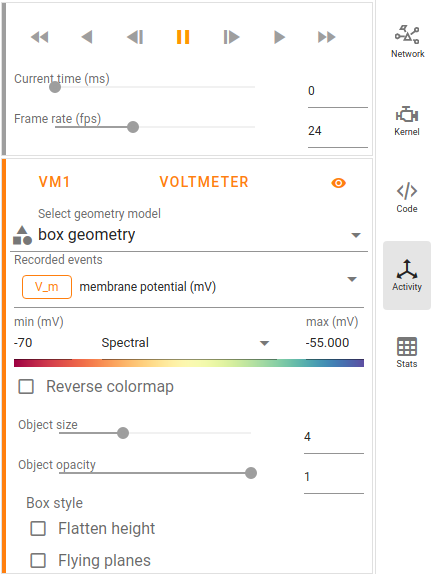
Activity animation controller
The animated graph displays activity (analog signals or spikes) for the spatial network forming layers in topology whose neurons have geographical positions.
Values of the analog signals can be visualized using the colors of recorded targets. Here, it shows the color map spectral for the value scales (from min to max). You can change the color map in the dropdown menu between the input fields of the min and max values.
Additionally, an other geometry model (box or sphere) can be chosen.
We recommend to try out many different options for the animation graph to find the best representation, as the optimal ones depend heavily on the simulation data and the intended use of the visualization.
Activity statistics
It displays multiple panels for each recording device. In each panel a table shows the activity statistics of recorded elements (rows) of a node (population).
In spike events, the columns show the spike counts, mean and standard deviation of \(ISI\) (inter-spike interval) as well as \(CV_{ISI}\) (coefficient of variation in inter-spike intervals).
In analog signals (e.g. membrane potentials), the columns show the mean and standard deviation of the values.
